• Data Analytics Fundamentals
  • Tools & Techniques for Data Analytics

Power BI: Data Visualization and Business Intelligence

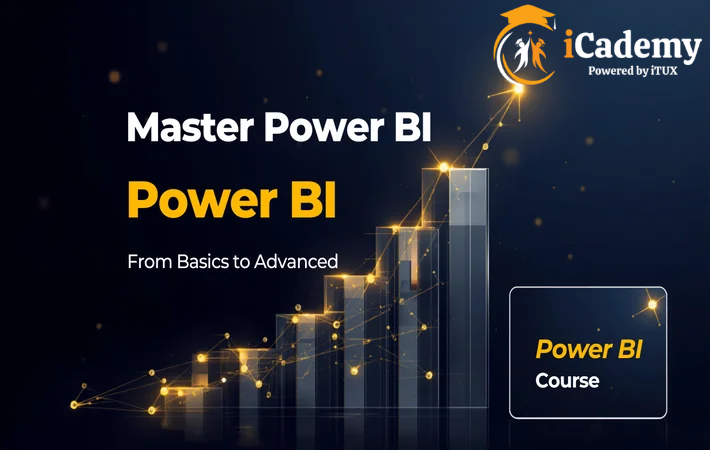
Transform Raw Data into Interactive Dashboards and Actionable Insights using Microsoft Power BI.

0.0
0 students
  • Last Updated 18 Dec, 2025
  • English
  • Certified Course
Card image

What you'll learn

What will students learn? (Learning Objectives)

By the end of this course, learners will be able to:

  1. Extract and Transform Data: Use Power Query to connect to various sources (Excel, SQL, Web) and perform data cleaning, pivoting, and merging to prepare it for analysis.
  2. Design Robust Data Models: Understand the principles of Star Schema and create relationships between different tables to ensure accurate data filtering and reporting.
  3. Master DAX (Data Analysis Expressions): Write complex formulas to create calculated columns and measures, enabling advanced calculations like Year-over-Year growth and Moving Averages.
  4. Create Interactive Visualizations: Build professional-grade reports using a variety of charts, maps, and slicers, and implement advanced features like drill-throughs and tooltips.
  5. Publish and Collaborate: Manage content in the Power BI Service, set up automated data refreshes, and share interactive dashboards securely with stakeholders.
Show More

Requirements

  • Operating System: Microsoft Windows is required (Power BI Desktop does not have a native Mac version). Software: Power BI Desktop (Free to download). Basic Excel Knowledge: Familiarity with Excel formulas and pivot tables is helpful but not mandatory. Beginner Friendly: No prior experience in data science or programming is required. We start from the absolute basics of data loading.

Industrial Training/ Market Trend

  1. Explosive Growth in Self-Service BI: Organizations are moving away from centralized IT reporting. There is a massive demand for employees who can analyze their own data using Power BI without waiting for technical teams.
  2. The "Data-Driven" Mandate: Modern companies (from Retail to Finance) now require "Data Literacy" as a core skill. Knowing how to interpret and present data is no longer optional for management roles.
  3. Integration with AI and Copilot: Microsoft is heavily integrating AI into Power BI. Professionals who can leverage AI-powered insights and "Quick Measure" features are becoming highly sought after.
  4. Migration from Legacy Systems: Many enterprises are migrating from older tools (like Tableau or Qlik) to Power BI due to its seamless integration with the Microsoft 365 ecosystem, creating a constant need for migration specialists.
Show More

Description

This course provides a deep dive into the world of Data Analytics using Power BI. You will learn the entire business intelligence workflow: from connecting to diverse data sources and cleaning "messy" data with Power Query, to building complex relational models and writing powerful DAX formulas. Finally, you will master the art of data storytelling by creating stunning, interactive reports that help businesses make data-driven decisions.

Show More

Instructor

Mohammed Asemuddin
Data Analytics, Python, Excel, Power BI.

Review

0.0
Course Rating
%
%
%
%
%
Video Images
Preview this course
4000.00 5000.00
Go to Cart
2-Day Money-Back Guarantee
Cancellation and Refund Policy
  • Lectures50
  • Skill LevelIntermediate
  • LanguageEnglish
  • Quizzes0
  • CertificateYes
  • Pass Percentage40%
Show More

Power BI: Data Visualization and Business Intelligence
4000.00 5000.00
Go to Cart